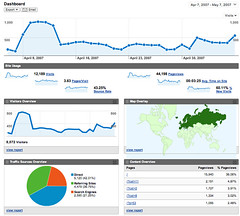
Google Announces In-Page Analytics - Visual Context For Google Analytics – Better Visualization Than The Site-Overlay.
 Image by vrypan via FlickrToday Google has announced the In-Page Analytics , with In – Page Analytics you can see your Google Analytics data superimposed on your website as you browse. Compared to this there is the site overlay report of Google Analytics which has not worked very well .
 In-Page Analytics of Google Analytics is still in beta so many of the functions may not work well. The site overlay also gave a similar overview but the visualization with in-page analytics is comparatively better as you can view the details regarding the clicks on each link of the page. This data is surely going to be helpful in deciding and tweaking the layout and navigation of the page which in turn shall help in increasing the CTR on the links of the page.
The best part is that you can apply filters and analyse the data as per your preference metrics and view and browse the selected preference.
View the video for the detailed information.
Labels: Google, Google Analytics


<< Home